Article overview
The goal of this Article is to compare the performances of
lay() to alternatives described here.
As you will see, the code using lay() is quite efficient.
The only alternative that is clearly more efficient is the one labeled
below “vectorized”. Unfortunately, such a vectorized approach
imply to refer explicitly to all column names which data are used.
Furthermore, such a vectorized approach is not applicable generally, as
it can only deal with logical and arithmetic operators and does allow
the use of other types of functions.
Loading packages
This Article requires you to load the following packages:
library(lay)        ## for lay() and the data
library(dplyr)      ## for many things
library(tidyr)      ## for pivot_longer() and pivot_wider()
library(purrr)      ## for pmap_lgl()
library(slider)     ## for slide()
library(data.table) ## for an alternative to base and dplyr
library(bench)      ## for running the benchmarks
library(forcats)    ## for sorting levels in plot with fct_reorder()
Please install them if they are not present on your system.
An example of a rowwise task
Consider the dataset drugs_full from our package
{lay}:
drugs_full
#> # A tibble: 55,271 × 8
#>    caseid hydrocd oxycodp codeine tramadl morphin methdon vicolor
#>    <chr>    <int>   <int>   <int>   <int>   <int>   <int>   <int>
#>  1 1            0       0       0       0       0       0       0
#>  2 2            0       0       0       0       0       0       0
#>  3 3            0       0       0       0       0       0       0
#>  4 4            0       0       0       0       0       0       0
#>  5 5            0       0       0       0       0       0       0
#>  6 6            0       0       0       0       0       0       0
#>  7 7            0       0       0       0       0       0       0
#>  8 8            0       0       0       0       0       0       0
#>  9 9            0       0       0       0       0       0       1
#> 10 10           0       0       0       0       0       0       0
#> # ℹ 55,261 more rows
In this dataset, all columns but caseid record the use
of pain relievers for non medical purpose.
For each drug there is a certain number of users and non-users:
drugs_full |>
  pivot_longer(-caseid, names_to = "drug", values_to = "used") |>
  count(drug, used) |>
  mutate(used = if_else(used == 1, "have_used", "have_not_used")) |>
  pivot_wider(names_from = used, values_from = n)
#> # A tibble: 7 × 3
#>   drug    have_not_used have_used
#>   <chr>           <int>     <int>
#> 1 codeine         53642      1629
#> 2 hydrocd         52633      2638
#> 3 methdon         54685       586
#> 4 morphin         54326       945
#> 5 oxycodp         51461      3810
#> 6 tramadl         54480       791
#> 7 vicolor         50358      4913
In this Article, we compare the efficiency of alternative ways to
create a new variable named everused which indicates if
each respondent has used any of the considered pain relievers for non
medical purpose or not.
We will run benchmarks on the dataset drugs_full and its
55271 rows, as well as on a subset of this data called
drugs that only contains 100 rows.
Benchmarks on the full dataset (55271 rows)
Let’s compare the running time of different methods to do this job on the full dataset:
drugs_full_dt <- data.table(drugs_full) ## coercion to data.table

benchmark1 <- mark(
  vectorized = {
    drugs_full |>
      mutate(everused = codeine | hydrocd | methdon | morphin | oxycodp | tramadl | vicolor)},
  lay = {
    drugs_full |>
      select(-caseid) |>
      mutate(everused = lay(pick(everything()), any))},
  lay_alternative = {
    drugs_full |>
      mutate(everused = lay(pick(-caseid), any, .method = "tidy"))},
  c_across = {
    drugs_full |>
      rowwise() |>
      mutate(everused = any(c_across(-caseid))) |>
      ungroup()},
  pivot_pivot = {
    drugs_full |>
      pivot_longer(-caseid) |>
      group_by(caseid) |>
      mutate(everused = any(value)) |>
      ungroup() |>
      pivot_wider()},
  pmap = {
    drugs_full |>
      mutate(everused = pmap_lgl(pick(-caseid), ~ any(...)))},
  slider = {
    drugs_full |>
      mutate(everused = slide_vec(pick(-caseid), any))},
  data.table = {
    drugs_full_dt[, ..I := .I]
    drugs_full_dt[, everused := any(.SD), by = ..I, .SDcols = -"caseid"]},
  apply = {
    drugs_full |>
      mutate(everused = apply(pick(-caseid), 1, any))},
  'for' = {
    everused <- logical(nrow(drugs_full))
    columns_in <- colnames(drugs_full) != "caseid"
    for (i in seq_len(nrow(drugs_full))) everused[i] <- any(drugs_full[i, columns_in])},
  iterations = 5,
  time_unit = "ms",
  check = FALSE
  )
#> Warning: Some expressions had a GC in every iteration; so filtering is
#> disabled.
Here are the results of this first series of benchmarks:
benchmark1 |>
  arrange(median)
#> # A tibble: 10 × 6
#>    expression           min   median `itr/sec` mem_alloc `gc/sec`
#>    <bch:expr>         <dbl>    <dbl>     <dbl> <bch:byt>    <dbl>
#>  1 vectorized          3.14     3.26  299.        2.74MB    0
#>  2 apply             116.     117.      8.50      4.01MB    3.40
#>  3 lay               144.     147.      6.67      5.49MB    1.33
#>  4 pivot_pivot       321.     329.      3.03     62.38MB    1.21
#>  5 pmap              383.     385.      2.60    251.29KB    2.60
#>  6 lay_alternative  1566.    1584.      0.633     15.3MB    1.65
#>  7 data.table       4075.    4095.      0.238     3.04MB    2.05
#>  8 slider           4705.    4728.      0.211   915.15KB    1.98
#>  9 for              9269.    9390.      0.106   271.73KB    2.16
#> 10 c_across        93000.   93327.      0.0107  424.32MB    0.932
benchmark1 |>
  mutate(expression = fct_reorder(as.character(expression), median, .desc = TRUE)) |>
  plot()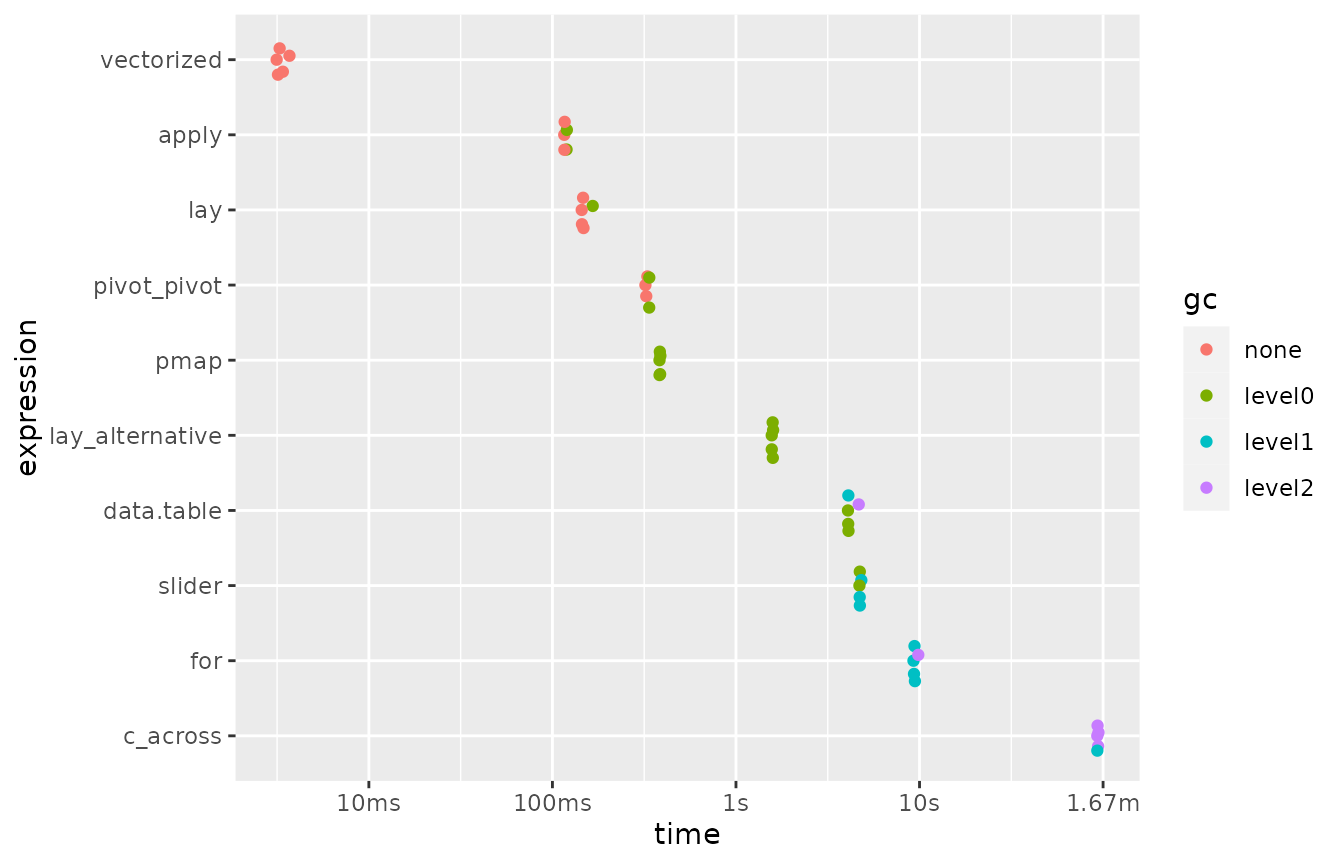
Note that the x-axis of the plot is on a logarithmic scale.
Benchmarks on a subset of the data (100 rows)
Let’s repeat our benchmarks using a only a subset of the original dataset:
drugs_dt <- data.table(drugs) ## coercion to data.table

benchmark2 <- mark(
  vectorized = {
    drugs |>
      mutate(everused = codeine | hydrocd | methdon | morphin | oxycodp | tramadl | vicolor)},
  lay = {
    drugs |>
      select(-caseid) |>
      mutate(everused = lay(pick(everything()), any))},
  lay_alternative = {
    drugs |>
      mutate(everused = lay(pick(-caseid), any, .method = "tidy"))},
  c_across = {
    drugs |>
      rowwise() |>
      mutate(everused = any(c_across(-caseid))) |>
      ungroup()},
  pivot_pivot = {
    drugs |>
      pivot_longer(-caseid) |>
      group_by(caseid) |>
      mutate(everused = any(value)) |>
      ungroup() |>
      pivot_wider()},
  pmap = {
    drugs |>
      mutate(everused = pmap_lgl(pick(-caseid), ~ any(...)))},
  slider = {
    drugs |>
      mutate(everused = slide_vec(pick(-caseid), any))},
  data.table = {
    drugs_dt[, ..I := .I]
    drugs_dt[, everused := any(.SD), by = ..I, .SDcols = -"caseid"]},
  apply = {
    drugs |>
      mutate(everused = apply(pick(-caseid), 1, any))},
  'for' = {
    everused <- logical(nrow(drugs))
    columns_in <- colnames(drugs) != "caseid"
    for (i in seq_len(nrow(drugs))) everused[i] <- any(drugs[i, columns_in])},
  iterations = 30,
  time_unit = "ms",
  check = FALSE
  )
Here are the results of this second series of benchmarks:
benchmark2 |>
  arrange(median)
#> # A tibble: 10 × 6
#>    expression         min median `itr/sec` mem_alloc `gc/sec`
#>    <bch:expr>       <dbl>  <dbl>     <dbl> <bch:byt>    <dbl>
#>  1 vectorized        1.29   1.35    729.      7.33KB     0
#>  2 apply             3.61   3.74    264.     16.92KB     0
#>  3 pmap              4.09   4.22    235.      9.91KB     8.11
#>  4 lay               5.95   6.09    163.     27.12KB     0
#>  5 lay_alternative   6.23   6.35    157.     38.05KB     0
#>  6 data.table        8.06   8.48    118.     67.66KB     4.06
#>  7 slider           11.9   12.4      80.3    11.18KB     0
#>  8 for              20.4   21.0      47.7    17.74KB     3.41
#>  9 pivot_pivot      21.9   22.6      44.2   189.47KB     1.52
#> 10 c_across        170.   174.        5.75  794.53KB     1.75
benchmark2 |>
  mutate(expression = fct_reorder(as.character(expression), median, .desc = TRUE)) |>
  plot(type = "violin")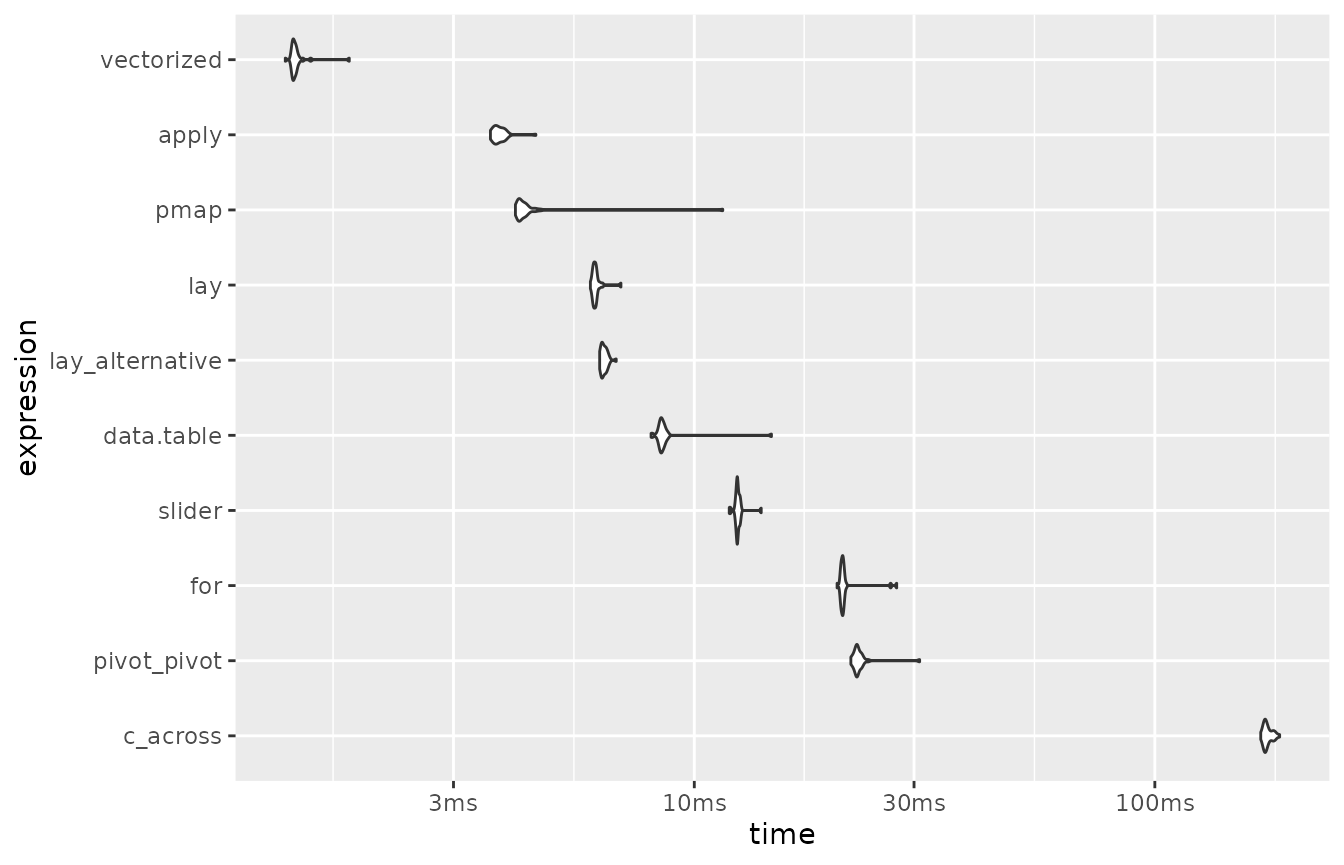
Note again that the x-axis of the plot is on a logarithmic scale.
Benchmarks’ environment
sessionInfo()
#> R version 4.3.1 (2023-06-16)
#> Platform: x86_64-pc-linux-gnu (64-bit)
#> Running under: Ubuntu 22.04.3 LTS
#>
#> Matrix products: default
#> BLAS:   /usr/lib/x86_64-linux-gnu/openblas-pthread/libblas.so.3
#> LAPACK: /usr/lib/x86_64-linux-gnu/openblas-pthread/libopenblasp-r0.3.20.so;  LAPACK version 3.10.0
#>
#> locale:
#>  [1] LC_CTYPE=C.UTF-8       LC_NUMERIC=C           LC_TIME=C.UTF-8
#>  [4] LC_COLLATE=C.UTF-8     LC_MONETARY=C.UTF-8    LC_MESSAGES=C.UTF-8
#>  [7] LC_PAPER=C.UTF-8       LC_NAME=C              LC_ADDRESS=C
#> [10] LC_TELEPHONE=C         LC_MEASUREMENT=C.UTF-8 LC_IDENTIFICATION=C
#>
#> time zone: UTC
#> tzcode source: system (glibc)
#>
#> attached base packages:
#> [1] stats     graphics  grDevices utils     datasets  methods   base
#>
#> other attached packages:
#> [1] forcats_1.0.0     bench_1.1.3       data.table_1.14.8 slider_0.3.1
#> [5] purrr_1.0.2       tidyr_1.3.0       dplyr_1.1.3       lay_0.1.3
#>
#> loaded via a namespace (and not attached):
#>  [1] sass_0.4.7        utf8_1.2.4        generics_0.1.3    stringi_1.7.12
#>  [5] digest_0.6.33     magrittr_2.0.3    evaluate_0.22     grid_4.3.1
#>  [9] fastmap_1.1.1     rprojroot_2.0.3   jsonlite_1.8.7    fansi_1.0.5
#> [13] scales_1.2.1      textshaping_0.3.7 jquerylib_0.1.4   cli_3.6.1
#> [17] rlang_1.1.1       munsell_0.5.0     withr_2.5.1       cachem_1.0.8
#> [21] yaml_2.3.7        ggbeeswarm_0.7.2  tools_4.3.1       memoise_2.0.1
#> [25] colorspace_2.1-0  ggplot2_3.4.4     profmem_0.6.0     vctrs_0.6.4
#> [29] R6_2.5.1          lifecycle_1.0.3   stringr_1.5.0     fs_1.6.3
#> [33] vipor_0.4.5       ragg_1.2.6        beeswarm_0.4.0    pkgconfig_2.0.3
#> [37] desc_1.4.2        warp_0.2.0        pkgdown_2.0.7     pillar_1.9.0
#> [41] bslib_0.5.1       gtable_0.3.4      glue_1.6.2        systemfonts_1.0.5
#> [45] xfun_0.40         tibble_3.2.1      tidyselect_1.2.0  knitr_1.44
#> [49] farver_2.1.1      htmltools_0.5.6.1 rmarkdown_2.25    compiler_4.3.1